point partitioning
After you spend all day banging your head against your own problems, sometimes it's just nice to bang it on something else for a bit.
This question came through on the postgis mailing list and it seemed like a good diversion. I think it's a very clear description of the problem. To quote:
So, I hacked up a quick solution. It's probably inefficient -- deleting keys from a dict, and removing entries from an rtree index. But, it's easy to understand, and (without the plotting) it runs in about 2 minutes for the requested 300000 points.
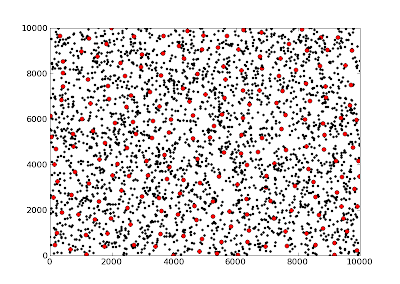
When plotting, the image looks like this:
and the code...
This question came through on the postgis mailing list and it seemed like a good diversion. I think it's a very clear description of the problem. To quote:
I have around 300,000 points, each with a lat, lon and altitude (also converted to geometry). I need to get a subset of those points, where none of them are within 5m (or some other arbitrary distance) of each other. It doesnt matter which points get picked over another, as long as whatever the data set it creates, that none of the points are within that 5m radius and that relatively most of the points are used
So, I hacked up a quick solution. It's probably inefficient -- deleting keys from a dict, and removing entries from an rtree index. But, it's easy to understand, and (without the plotting) it runs in about 2 minutes for the requested 300000 points.
When plotting, the image looks like this:

and the code...
import rtree
import random
import pylab


dist = 500
index = rtree.Rtree()
points = {}  # xy coords. use dict to delete without changing keys.
groups = {}  # store the grouped points. all keys are > dist apart

# create some random points and put them in an index.
for i in range(3000):
    x = random.random() * 10000
    y = random.random() * 10000
    pt = (x, y)
    points[i] =  pt
    index.add(i, pt)

print "index created..."

while len(points.values()):
    pt = random.choice(points.values())
    print pt
    bbox = (pt[0] - dist, pt[1] - dist, pt[0] + dist, pt[1] + dist)

    idxs = index.intersection(bbox)
    # add actual distance here, to get those within dist.

    groups[pt] = []
    for idx in sorted(idxs, reverse=True):
        delpt = points[idx]
        groups[pt].append(delpt)
        index.delete(idx, delpt)
        del points[idx]

# groups contains keys where no key is within dist of any other pt
# the values for a given key are all points with dist of that point.

for pt, subpts in groups.iteritems():
    subpts = pylab.array(subpts)
    pylab.plot(subpts[:,0], subpts[:,1], 'k.')
    pylab.plot([pt[0]], [pt[1]], 'ro')

pylab.show()
Comments