Posts

openlayers, genomes and image-maps

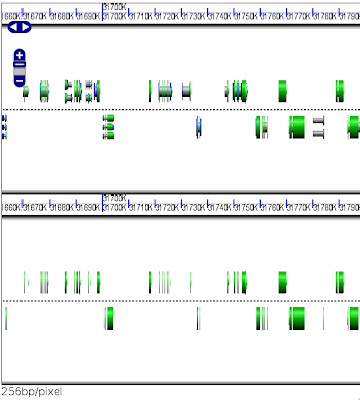
In response to Titus' post on using imagemaps for genomic visualization: Why are imagemaps so popular in genomics? As an extreme and unfair comparison, just imagine if http://maps.google.com was an image map. Given a CGI script that can accept a url like &start=1024&stop=2048&chr=3 and return an appropriate image, you can provide a substantial set of tools using openlayers , which is developed by what must be one of the largest and active developer communities in GIS. (Yes, I am an openlayers fan-boy.) You can do that with a small addition to openlayers which I updated a couple weeks ago to OL version 2.6. In that update, I removed > 140 lines of code . So, it's now even less of a change to OL. Maybe when 2.7 comes out, I'll figure out how to provide a patch that allows an extra argument to the OpenLayers.Map constructor that limits panning to the horizontal direction -- in which case genome-browser will cease to exist and only the single file containing ...

seqfind: levenshtein + bktree

I've copied this recipe that I modified before, and added the BK Tree structure in cython. It's in my repo here . Check it out with: svn checkout http://bpbio.googlecode.com/svn/trunk/seqfind or easy_install with sudo easy_install http://bpbio.googlecode.com/svn/trunk/seqfind It's now using the Damerau-Levenshtein distance which is more sensible for bioinformatics where transpositions are frequent. Bearophile's original implementation used a tuple, which made sense, but in Cython, it's more efficient to use an object where the properties can be typed--as a class is converted to a c-struct--so there is no conversion when appending to a python array -- if i understand the generated c code correctly. Using an object also allows arbitrary info to be passed along with the word when creating the tree, again, this is important for bio-informatics when the string is something like "actgcc ... acgtc" and it's useful to attach some annotation to it like: word...

flash (n)back

The PNAS article linked here found subjects could improve IQ with training. I've written a simple flash version of their protocol over a couple long evenings in haxe /flash. The article methods list 2 stimuli, a moving box, and spoken letters. The test subject is to respond (click in my case) when the box position or the spoken letter is the same as it was 2 time steps ago. Where 2 is increased as the subject gets better. I didn't do sound, I just show a big letter. Clearly, the logical thing to do is use it for a couple weeks and then implement the sound when I'm smarter. (I've never really used swfmill , but I think that'd be useful here...) The article is ambiguous about when the letter is to sound, I've made both the letter and the box appear at the same time. The default, as in the article is to have 3 seconds between events, and to show the box for 0.5 seconds. I also add some indication of whether the answer was correct (green +) or not (red -). That act...

levenshtein in cython

EDIT(2): fix markup for <char *> casts ... fix malloc (see comments. thanks Bao). NOTE: using a kwarg for limit slows things down. setting that to a required arg and using calloc for m2 speed things up to nearly as fast as the pylevenshtein. Well, it seems to be popular to code up the levenshtein . I actually have a use for this and wanted to practice some Cython , so I've written a version. I used bearophile's recipe , wikibooks , this (from k4st on reddit) and this for reference. It follows bearophile's code closely, using only O(m) space instead of O(mn). cdef extern from "stdlib.h": ctypedef unsigned int size_t size_t strlen(char *s) void *malloc(size_t size) void free(void *ptr) int strcmp(char *a, char *b) cdef inline size_t imin(int a, int b, int c): if a if c return c return a if c return c return b cpdef int levenshtein(char *a, char *b, int limit=100): cdef int m = strlen(a),...

numpy to tiff via gdal

EDIT: 7 months later I came back to this and found an error. update in the code below with old line commented out. Rather than venting about a project I've recently decoupled myself from, I'll try to do something constructive... I also posted this to the gispython mailing list, but I've had to figure it out a couple times, so I'll put it here for the record. Given an N * N numpy array, and a bounding box, it's actually fairly simple to make a georeferenced tiff: from osgeo import gdal, gdal_array import numpy from osgeo.gdalconst import GDT_Float64 xsize, ysize = 10, 10 a = numpy.random.random((xsize, ysize)).astype(numpy.float64) xmin, xmax = -121., -119. ymin, ymax = 41., 43. driver = gdal.GetDriverByName('GTiff') # bad: out = driver.Create('a.tiff', a.shape[0], a.shape[1], 1, GDT_Float64) # the args to Create are 'name', xsize, ysize. and .shape[0] is rows, which is y. driver.Create('a.tiff', a.shape[1], a.shape[0], 1, GDT_Float64...

python script as wsgi, cgi, or standalone

EDIT: See below for original, I realized this could be done cleanly with a decorator . The decorator wrapplication takes the number of the port to use when called as a standalone server. The EMiddle class is unnecessary, it's just used as middleware to update the environ to show it came via wsgi. If there's a cleaner way, let me know. #!/usr/bin/python import os class EMiddle(object): def __init__(self, app): self.app = app def __call__(self, env, start_response): env['hello'] = 'wsgi' return self.app(env, start_response) def wrapplication(port): def wrapper(wsgi_app): if 'TERM' in os.environ: print "serving on port: %i" % port os.environ['hello'] = 'standalone' from wsgiref.simple_server import make_server make_server('', port, wsgi_app).serve_forever() elif 'CGI' in os.environ.get('GATEWAY_INTERFACE',...

Genedex: query genomic features and sequence

Normally, I don't write libraries, I figure smarter people than I should do such things, and I should just use them. But, I got tired enough of writing one-off scripts for genomic feature manipulation-- find the upstream, downstream neighbors and get the sequence -- and I saw enough of the pieces coming together that I decided to build it. I'd complained before about how rtree didn't support 1D indicies. Not only is this not a problem, it's beneficial. Genomic features should have strand information, so that's the 2nd dimension. Then rtree does containment queries, so it's simple to find only the features on a given strand. I realized this about the same time that the docstring for numpy's memmap went from 0 lines to about 100, and it was enhanced to take a filehandle , not just a filename. This means you can send in a start position and a shape to the numpy.memmap constuctor and it can create a numpy array of only that chunk. This means that it's pos...

comparative genomics with openlayers

Image
Traditional genome browsers, look like this . In fact, I think that's the most popular genome-browser used--gbrowse. They display information in tracks, so any layer of annotation you just add on to the bottom of the image (after making the image taller). This doesnt work for genome-browser, the hack of openlayers to support only horizontal scrolling, because you if you have 2 adjacent tiles, if one has more features than the next, there's not guarantee that they'll be the same height, and no guarantee that a feature that's on both images will align correctly. I was just hacking around, trying to test some work I'd done and realized that you can have annotation layers with OpenLayers, just add another map, and tie them together! So that's 2 OpenLayers.Map() instances. What makes this easy is the new Map.panTo() methods in OpenLayers 2.6 (which is in release candidate 1). So, the top map registers for 'move' and 'zoomend' events with callbacks th...

featureserver authentication

As the name implies, featureserver serves vector features to various formats from a number of datasources, including OGR -- which means pretty much any vector format. That's extremely powerful. Really. That means, for instance, that when you're working on a really cool project and all anyone wants to know is if they can see it in KML/Google Earth, it's no extra work. Just point them to the REST-ful url like "http://example.com/featureserver/all.kml", and continue working on the cool project. Likewise for all.gml, .atom, etc. And, if you have a project with spatial data, if you put it in a format that featureserver understands, it's displayable, and editable in openlayers. The next thing people want in a web application is some sort of user restrictions. In featureserver, by default, anyone can do any of the CRUD operations on any feature. I've been playing with a soon-to-be-open-sourced PPGIS (apparently the trendy acronym for that is now VGI ) projec...

reading code

A fasta file of rice genomic sequence is 355MB. It's not easy to understand how large that is. This is an attempt to come up with a quick metric. So, I downloaded Ulysses . wc shows it to have 267235 words. Some googling says the average person can read 250 words per - minute. So that's 267,235 / 250 / 60 = 17.8 hours. Well, it's hard to believe anyone can really read Ulysses in 18 hours but... good enough. So on the rice fasta file i ran: grep -v ">" rice.fasta | wc -c to get rid of the 12 header lines (1 per chromosome) and only count sequence (should be within 12 characters counting the extra new-lines). That gives 372,077,765 characters. The average word-size in ulysses is 5. I rounded up to 6. So, the rice sequence has the equivalent of 372,077,765 / 6 = 62,012,960 words So, at 250 words per minute, it'd take: 62012960 / 250 / 60 = 4,134 hours to read the rice genome . That's 172 days. Also, from what I know, the plot is hard to follow. Genome siz...

point partitioning

Image
After you spend all day banging your head against your own problems, sometimes it's just nice to bang it on something else for a bit. This question came through on the postgis mailing list and it seemed like a good diversion. I think it's a very clear description of the problem. To quote: I have around 300,000 points, each with a lat, lon and altitude (also converted to geometry). I need to get a subset of those points, where none of them are within 5m (or some other arbitrary distance) of each other. It doesnt matter which points get picked over another, as long as whatever the data set it creates, that none of the points are within that 5m radius and that relatively most of the points are used So, I hacked up a quick solution. It's probably inefficient -- deleting keys from a dict, and removing entries from an rtree index. But, it's easy to understand, and (without the plotting) it runs in about 2 minutes for the requested 300000 points. When plotting, the image lo...

OGR python projection

OGR Projection If you're using shapely and you need to do projections, you'll either have a lot of boilerplate or a function like this one. Actually, even in OGR, there's a lot of bioler plate involved in transforming.... from osgeo import ogr from shapely.wkb import loads def project(geom, to_epsg=900913, from_epsg=4326): """utility function to do quick projection with ogr, to and from shapely objects >>> from shapely.geometry import LineString >>> l = LineString([[-121, 43], [-122, 42]]) >>> lp = project(l, from_epsg=4326, to_epsg=26910) >>> lp.wkt 'LINESTRING (663019.0700828594854102 4762755.6415722491219640, 582818.0692490270594135 4650259.8474613213911653)' """ to_srs = ogr.osr.SpatialReference() to_srs.ImportFromEPSG(to_epsg) from_srs = ogr.osr.SpatialReference() from_srs.ImportFromEPSG(from_epsg) ogr_geom = ogr.CreateGeometryFromWkb(geom.wk...

spatially explicit metapopulation models in scipy.

Image
Making Pretty Pictures I started to learn to program about 5 years ago running population ecology models in mathematica . Yesterday, I found an old mma notebook with a model modified to include differential parasitoid dispersal to adjacent host cells depending on the host density in those cells. It's bascially a discrete-time Nicholson-Bailey model . But in a grid of cells, where each cell contains a population of hosts (H) and parasitoids (P) that give birth, die, eat, and get eaten according to the NB model. Each generation, following birth/reproduction/predation, the hosts and parasitoids disperse. The hosts disperse equally to the 8 surrounding cells in their neigbhorhood. The parasitoids can move irrespective of host densities when the aggregation parameter (eta) is 0. When aggregation is 1 (eta == 1), the parasitoids move to adjacent cells in exact proportion to host densities in each of the surrounding cells. muH and muP (i'm too lazy to figure out how to write the symb...

rtree: know your nearest neigbhors

My computer spends a lot of time looking for neighbors of a given location-- even more so for bio, than for geo. This is what I've learned about the options for doing smarter search so far. SELECT * from ( (SELECT * FROM ((SELECT * FROM feature WHERE start = ? ORDER BY start LIMIT 1)) as u) UNION (SELECT * FROM ((SELECT * FROM feature where stop = ? ORDER BY stop LIMIT 1)) as v) ) as w ORDER BY ABS((start + stop)/2 - ?) LIMIT 1 if you fill in ? with an integer location, that query will return the closest feature most of the time. It's verbose if not ugly, and that's only for 1 dimension. It can return the wrong feature in certain cases.... You have to write it like that in MySQL, because it doesnt support functional indexes , so as soon as you do something like: ORDER BY ABS((start + stop)/2 - ?) it's no longer an indexed search It's a hard problem, even if you're using postgis . And even if you're a postGIS badass . Other than postGIS, there postgres...

What a Shapely genome you have!

Image
This might be a case of if you have a really cool hammer , everything looks like a nail, but it was fun mixing tools from different disciplines. After finding synteny , there's a bunch of paired genes whose neighbors are also pairs. Paired ( homologous ) genes have similar sequence because they have some function and can't change without loss of function. Non-gene sequence between the paired genes is mostly randomized via mutation, deletion, etc. But, there is non-gene sequence that is conserved between the genes. These CNS's-- conserved non-coding sequences--are usually sites that bind stuff that regulates the expression of a gene. That looks like this. With one gene on the top, and its pair below, both yellow. Pink lines in the foreground connect putative CNSs (similar sequences) between these genes. That the lines cross is bad. CNSs occur right at the level of noise. So even though a similar sequence occurs near both genes, it could be by chance. It is possible to red...

flash, vi, fcsh

All my flash tinkering has been in VIM-- no IDE, no XML, just actionscript. It's a little tough to deal with the adobe compiler as it takes about 11 seconds to compile a large project like modestmaps on my machine. That's not good for a guess-and-check programmer. The typing does catch some errors. The worldkit project compiles instantaneously with mtasc (the predecessor to haxe )--likewise for the as2 branch of modestmaps. The flash compiler shell drops the compile time for as3 modestmaps to under 3 seconds, so I've added this to my .bash_aliases: alias fcsh="/usr/bin/rlwrap /opt/src/flex2/bin/fcsh" the rlwrap is to use readline in the flash shell--meaning I can just press up-arrow to get the previous compile command. By default, one has to paste or type the entire command again. With that, it's close to a reasonable workflow.

synteny mapping

Image
Living in Synteny I've been working on automating synteny mapping between any pairs of genomes. Synteny is where there's a stretch of DNA or genes in some order on chromosomeA of organismX and due to a shared evolutionary history, you can find a similar stretch of genes in order on chromosomeB of organismY. Often there are small losses and inversions, but between closely related organisms like man and mouse , there's still a lot of synteny. Plants can undergo polyploidy , following which, a species can have 2 entire copies of its genome. Over time, much of the duplicated cruft is lost, and the homologous chromosomes diverge, but if the divergence is not too great, it's still possible (actually common) to find synteny within the genome of a single organism--as well as between organisms. I've written my own algorithm to find synteny which uses python sets, and numpy array slicing to do the heavy lifting. It is quite clever [wink]. And it _almost_ works but it'...

open source gis and flash maps part two

Mash Flap I started looking into flash mapping stuff lately. For the patch I submitted to worldkit, Mikel gave me commit access! So, now the svn version of worldkit can be compiled with mtasc by typing "make". I feel unreasonably proud of that, given that much of what I did was some global search and replace stuff in VI, and then read and fixed mtasc compiler errors until they went away. It was good fun. Michal Migurski saw in that same post that I mentioned modestmaps and gave me some good ideas on getting WMS going. I just figured out how to get that working and posted a message to their overly web2.0 forums. Hopefully someone with some real actionscript skillz will clean it up. A mapping library without a good WMS interface is much less useful for most of the stuff I do. I haven't decided whether to use modestmaps or worldkit, or both. The time stuff the Mikel has done in worldkit is very cool and I haven't really looked at that yet. But I have a tim...

fast python with shedskin

There's a new release of the shedskin compiler. It is able to generate fast shared libraries that can be run from CPython. It can also create binaries so I thought I'd see how it did on some code from this BMC bioinformatcs article compared to psyco and CPython. I took this iterative, brute-force ( Needleman-Wunsch ?) alignment code and modified it slightly. That's pasted here . (Notice the first line! that's how it appears in the original code). The modifications allow shedskin to infer the function and variable types. Plus, there's a couple changes I made that improve the run-time for all cases. The max() function is also in the original, but unnecessary because of python's builtin max(), however, pysco does run much faster using their hand-coded max(). For the shedskin run, I removed that extra code and used shedskin's builtin 'cause it made me feel better. The python code was run as $ time python -c "import alignment; alignment.imain()"...

Python Mapscript Tricks

Image
I mentioned previously a site which uses google maps with a WMS. The problem with using points (or labels) in a tiled application such as google maps, or OpenLayers is that each tile can only draw its own contents. So if you draw a point with a radius of 10 pixels whose center is 2 px away from the edge of the tile, then 8px of the entire 20px will be chopped. By default, those lost 8 pixels will not be drawn in the adjacent tile because the center of the point does not fall in that tile. so that gives something that looks like this for 2 adjacent tiles: It's hard to even tell that those tiles belong together! Using some python mapscript and PIL , it's pretty simple to make those look like this( except I dont know how to tell blogger not to add the spacin...) : That's actually the same WMS request(s), just changing the call from a simple WMS CGI script that calls mapserver to a WSGI script that uses python mapscript and PIL. The script: 1. takes the current bounding bo...